CW, LW and Karlsruhe are very heavy.
Voronoi diagram(Automatic version)ÅEVoronoi diagram(Click version)
Farthest point Voronoi diagram(Automatic version)ÅEFarthest point Voronoi diagram(Click version)
Elliptic Voronoi diagram(Automatic version)
Ordinary Voronoi diagram(Open 2/Sep/2000 : The 13th Revision Thursday, 03-Jun-2010 22:12:51 JST)
There are some points (facilities) in a region. Let us assume that consumers use the nearest facility. Then, the Voronoi diagram explains the catchment area of each facility.
Let us define n points as p(1),...,p(n). The Voronoi region of p(i) is explained by
V(p(i)) = {x|d(x,p(i) ? [Note: Please check the change.] d(x,p(j), for all j(not i)}.
In the case of an Ordinary Voronoi diagram, the distance d is Euclidean.
The Voronoi diagram comprises the set of Voronoi regions,
{V(p(1),...,V(p(n))}.
An edge of an ordinary Voronoi diagram is generally a segment of a perpendicular at a midpoint.
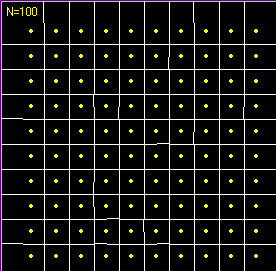 Voronoi diagram for square lattice generators
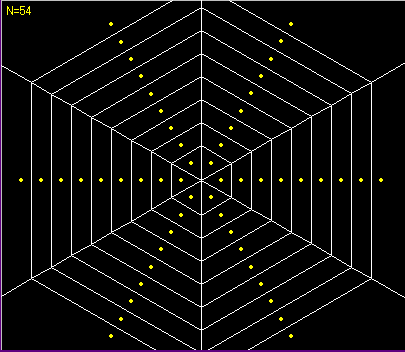 Voronoi diagram like spider web 1
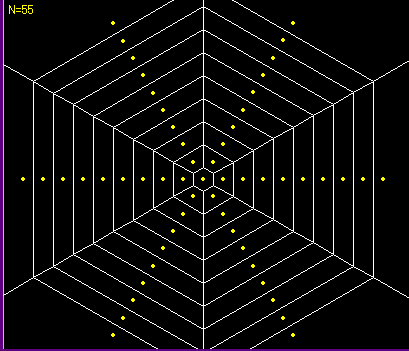 Voronoi diagram like spider web 2
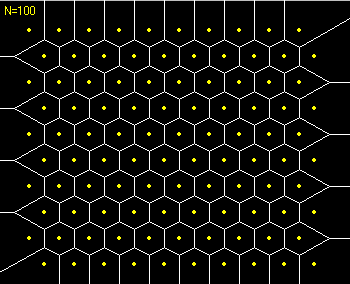 Voronoi diagram like beehive
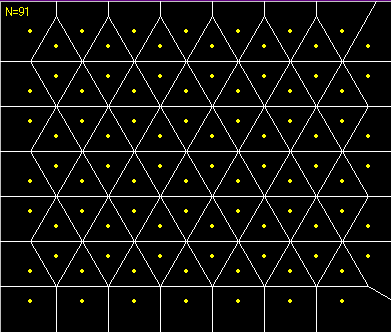 Voronoi diagram for hexagonal lattice generators
Reference
A.Okabe, B.Boots, K.Sugihara, WILEY, SPATIAL TESSELLATIONS
Source of program
Java(voro.java 6KB)
MS Visual Basic(vbvoro.lzh)
Algorithm
i=1,...,N-1
    j=i+1,...,N
        Consider a bisector of p(i) and p(j)
        k=1,...,N except for i and j
            Consider a bisector of p(i) and p(k)
            Calculate the points of intersection of bisector(i,j) and bisector(i,k)
        next k
        Add the points x=0 and x=(the width of screen) of the bisector (i,j) into the points of intersections
        Sort the points of intersections in terms of x coordinates
        k=1,...,the number of intervals of the points of intersections
            Let c be a midpoint of the interval of the points of intersection.
            Let d be d(c,p(i))
            h=1,...,N except for i and j
                Let d' be d(c,p(h))
                If d'<d then shout (Out!)
            next h
            If we did not shout, then draw the interval of the points of intersection
         next k
    next j
next i
If you have a message, don't hesitate to send it by using
E-mail: Mail Form
or
BBS
Use of Takashi Ohyama's website
English Home of Takashi Ohyama
Japanese Home of Takashi Ohyama
 Voronoi diagram for square lattice generators
 Voronoi diagram like spider web 1
 Voronoi diagram like spider web 2
 Voronoi diagram like beehive
 Voronoi diagram for hexagonal lattice generators
 Mail Form